Possible Ancient Oceans on Mars: Evidence from Mars Orbiter Laser Altimeter Data
Figures from the Science* Paper
*Head, J.W., H. Heisinger, M.A. Ivanov, M.A. Kreslavsky, S. Pratt, B.J. Thomson, Science, 286, 2134-2137, 1999.
Download a PDF version of the paper.
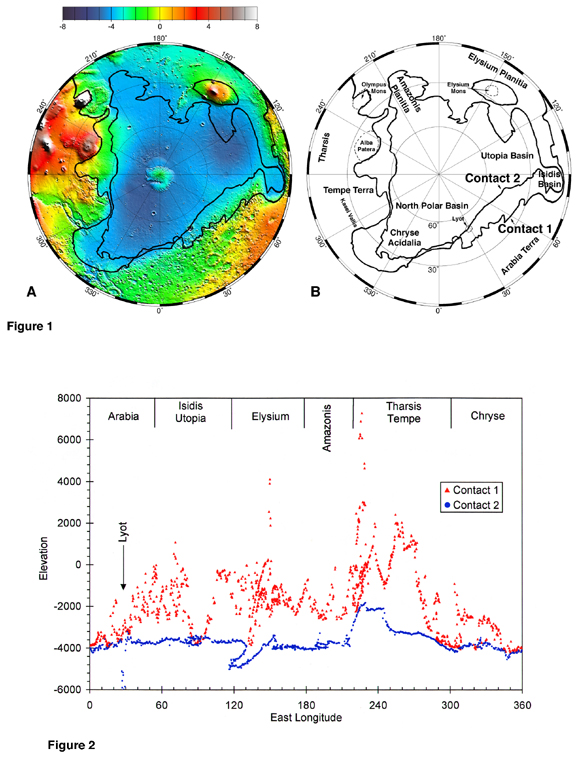
Figure 1. (A) Lambert equal-area projection of MOLA north pole to equator topography (15). Black lines indicate position of contacts interpreted to be shorelines. (B) Major features described in the text. (Credit: MOLA Science Team)
Figure 2. Elevation of Contacts 1 and 2 as a function of longitude. Data are through orbit 10464, April 15, 1999 (revision d). (Credit: MOLA Science Team)
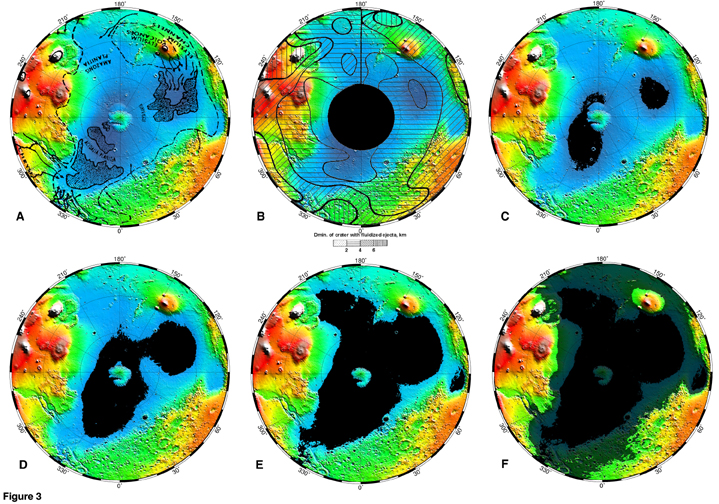
Figure 3. (A) Distribution of polygons (stippled areas) (20). (B) Distribution of onset diameter of impact craters with ejecta lobes. (C-F) Sequential flooding of the northern lowlands. Flooded to a total depth of: (C) 500 m, (D) 1000 m, (E) 1490 m (level of Contact 2), and F) the mean level of Contact 1 (-1680 m). (Credit: MOLA Science Team)
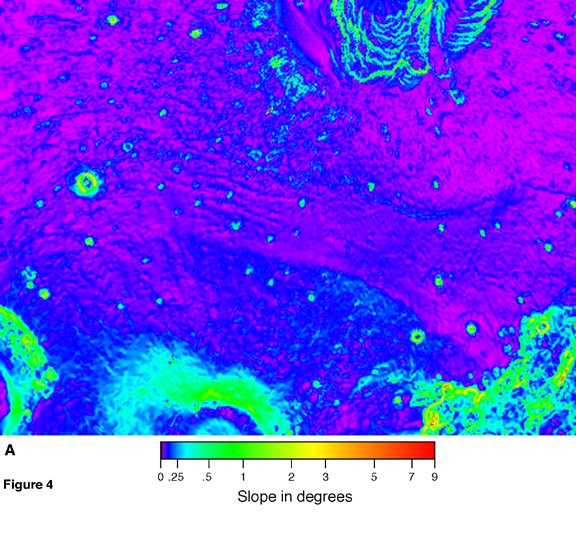
Figure 4a. Slope map of the northern lower flanks of Alba Patera, showing the absolute value of surface slope at ~15 km baseline derived from the 1/8 degree per pixel digital elevation model (15). Parallel lines (middle) representing linear slope changes are seen between Alba Patera (bottom) and the North Polar cap (top). Width of map is ~3000 km. (Credit: MOLA Science Team)
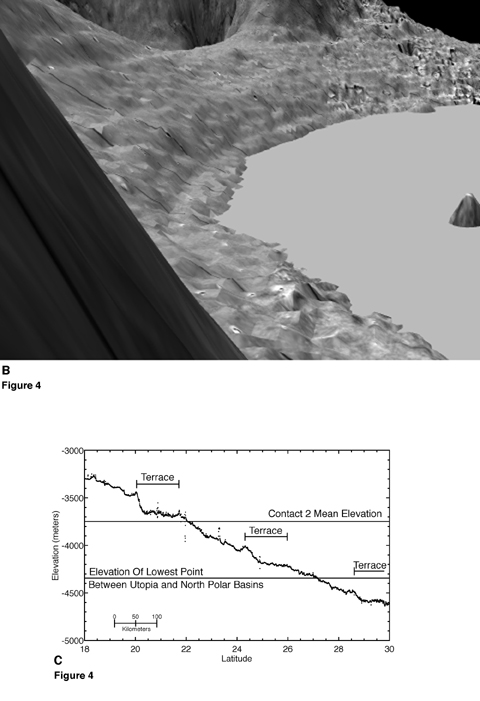
Figure 4b,c. (B) Perspective view of the southern margin of Utopia Planitia looking west from the flank of Elysium Mons showing topographic terraces parallel to Contact 2; MOLA DEM with Viking Orbiter mosaic superposed and the basin flooded to just below the -4350 contour, the elevation where the Utopia and North Polar basins become interconnected. Vertical exaggeration is ~200x. C) MOLA profile (10190) in southern Utopia Planitia. (Credit: MOLA Science Team)
Back to MOLA home
page
Direct inquiries to: dsmith@tharsis.gsfc.nasa.gov