First MOLA Data in the MGS Circular Orbit


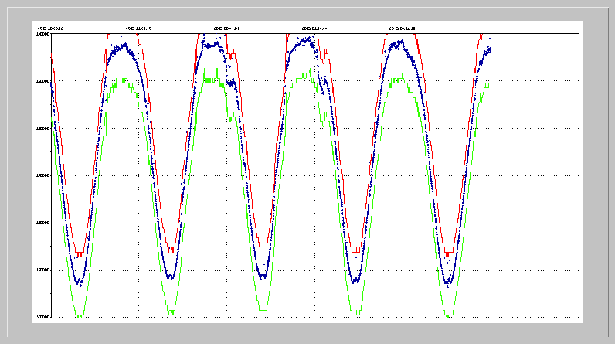
This plot shows the first data downloaded from MOLA in the MGS circular orbit on March 1, 1999. MOLA range measurements are shown in blue while the limits of the the range window are shown in red and green. The sinusoidal shape of the plot is due to the fact that the MGS polar circular orbit is in fact very slightly elliptical. The spacecraft periapsis is at the south pole, which is shown at the peak of the sinusoids. The north pole is shown at the troughs of the sinusoids. One wavelength corresponds to a single spacecraft orbit around Mars. The departure from sinusoidal shape after the peaks of the middle sinusoids is actually the Hellas basin.
Return to the MOLA Science homepage
| 

 MOLA
MOLA


