|
National Aeronautics and Space Administration Goddard Space Flight Center |
SEARCH NASA |
 MOLA MOLA |
* Mitrofanov, I., M.T. Zuber, M.L. Litvak, W.V. Boynton, D.E. Smith, D. Drake, D. Hamara, A.S. Kozyrev, A.B. Sanin, C. Shinohara , R.S. Saunders, and V. Tretyakov, CO2 snow depth and subsurface water ice abundance in the north hemisphere of Mars, Science, 300, 2081-2084, 2003.
Download a PDF version of the paper.
Dowload more figures and animations courtesy of the NASA/GSFC Scientific Visualization Studio.
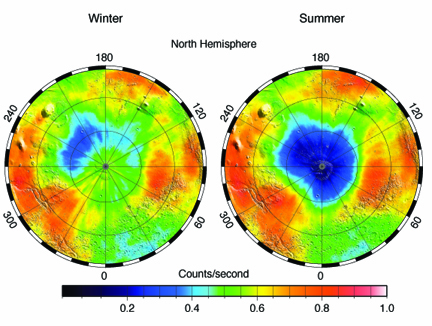
Figure 1. Polar maps of epithermal neutron flux from northern hemisphere of Mars as measured during northern winter (Ls=330° - 360°) and summer (Ls=100° - 165°). The maps have a pixel resolution of 1° X 1° (60 km X 60 km) and have been smoothed with linear averaging in 50X50 cells. The count rate of the neutron flux has been normalized by its maximum value, which is observed in the equatorial Solis Planum region at 270° E, 25° S. (Credit: HEND and MOLA Science Teams)
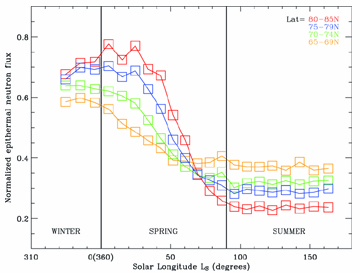
Figure 2. Seasonal variation of average fluxes of epithermal neutrons for latitudinal annuli in the northern hemisphere: 80°-85° N (red); 75°-79° N (blue), 70°-74° N (green) and 65°-69° N (yellow). The normalized neutron flux is shown by square symbols where the size of the symbol corresponds to the statistical error. (Credit: HEND and MOLA Science Teams)
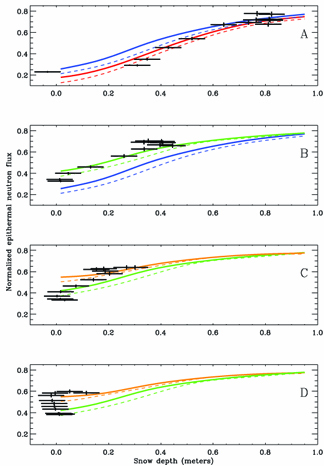
Figure 3. Correspondence between neutron flux and condensed CO2 depth for northern longitude belts. The X axis corresponds to MOLA measurements of condensed CO2 depths, and the Y axis corresponds to normalized neutron flux observed by HEND. Data points (bold dots) are shown for latitudinal annuli: (A) 80 °-85 ° N, (B) 75 °-79 °N, (C) 70 °-74 ° N and (D) 65 °-69 °N. These data points for MOLA and HEND correspond to a range of Ls from 330° to 112° . HEND data continuously cover the interval of Ls stated at Ls = 330° (February 18, 2002) and finished at Ls =112° (December 22, 2002). MOLA observations were combined for two different seasons from February 28, 1999 to March 20, 1999 (Ls=103°-112°) and from April 1, 2000 to November 15, 2000 (Ls=329°-77°). Calculations for four-layer model are represented by solid and dash curves for 50 wt % of H2O and 75 wt % of H2O in the lower layer, respectively. The variable depths of condensed CO2 layer hCO2 are shown along X axis. Cyan, violet, yellow and black curves represent the set of drier layers with column densities hdry = 10 g cm-2, 20 g cm-2, and 40 g cm-2, 60 g cm-2. (Credit: HHEND and MOLA Science Teams)