|
National Aeronautics and Space Administration Goddard Space Flight Center |
SEARCH NASA |
 MOLA MOLA |
Below are some examples of MOLA radiometry observations in Syrtis Major, the darkest area of Mars. The charts below show temporal changes, and a comparison to TES Lambert albedo results for the same area.
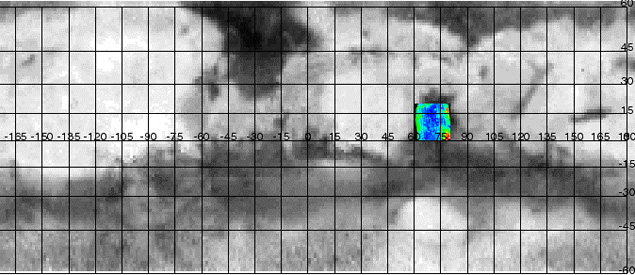
Location Map of Syrtis major that shows the study area. (Credit: MOLA Science Team)
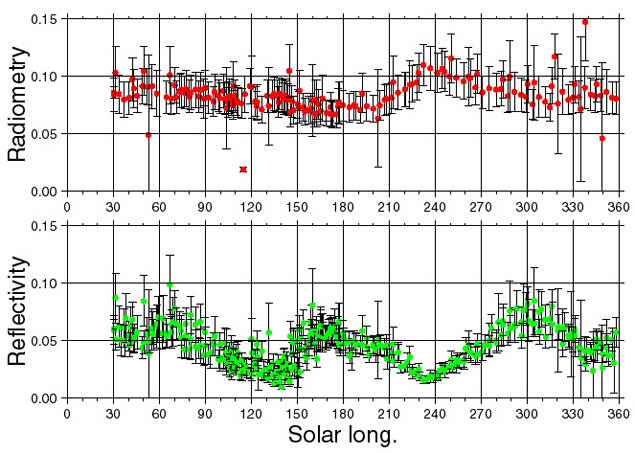
MOLA reflectivity and radiometry data vs Ls for Syrtis Major. Error bar values are standard deviation over 1 day, when measurements were taken. Note that the time series are clearly anti-correlated, especially during the dust storm season (Ls=210-270.). (Credit: MOLA Science Team)
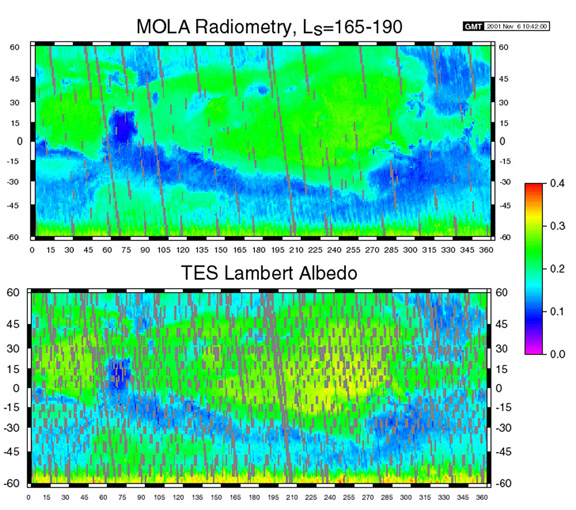
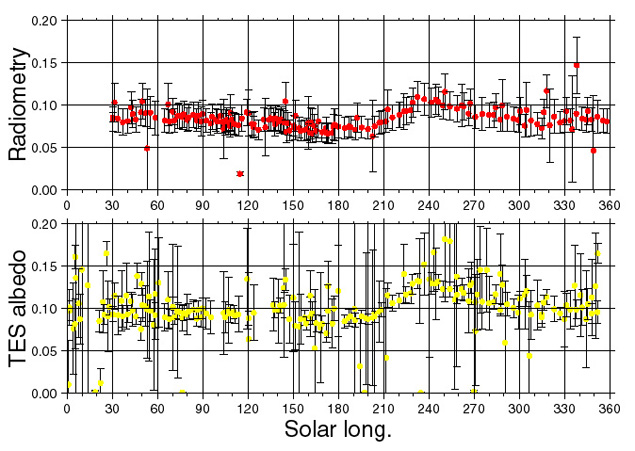
MOLA radiometry and TES Lambert Albedo for relatively dust free period (Ls=165-190). Overall, TES Lambert albedo is 10% brighter than MOLA radiometry. Missing data in the TES image is due to numerous limb observations by that instrument in order to study the Martian atmosphere. (Credit: MOLA Science Team)